The Weekly Random Walk – December 4, 2023 From Stephen Colavito
An Aggregation of Various Economic, Market Research, and Data


Let’s Make a Deal
Let’s Make a Deal was a television game show that originated in the US in 1963 (even before our time) and has since been produced in many countries worldwide.
The format of Let’s Make a Deal involves selected studio audience members, referred to as “traders,” making deals with the host. In most cases, a trader would be offered something of value and given a choice of whether to keep it or exchange it for a different item. The program’s defining game mechanism is that the other item is hidden from the trader until that choice is made. The trader thus does not know if they are getting something of equal or greater value or a prize that is referred to as a “zonk,” an item purposely chosen to be of little or no value to the trader.
This week, we will examine what we “currently have” versus what we could trade into in the future. The idea (like the game show) is not to get “zonked.”
What Is The Value of Investments In Our Hand Now?
We realize this is a play on words because we are talking about equity valuations in a slightly different way (but you have to admit the pun isn’t bad). As equity markets rallied in November, the return of the S&P 500 to YTD highs has caused some valuation concerns, especially since the rally coincides with a likely earnings deceleration as the economy cools. As we have discussed in “Walks” in the past, the market believes in a Goldilocks scenario, which is why we have seen “risk-on” investing. Current P/E ratios are not far off historical averages outside of tech valuations. Excluding large-cap tech, the current P/E ratio of the S&P 500 is 16x, which is not much above its 20-year average. Valuations around the rest of the world are, in fact, cheap relative to history, trading at or below median levels. A decline in global dividend yields relative to bond yields is also a worry for asset allocators. However, shareholder yield across the major markets remains relatively high, somewhat dampening the effect of higher bond yields.

Suppose we drill down from a traditional valuation perspective. In that case, the “Magnificent 7” (Google, Apple, Microsoft, Amazon, Tesla, Nvidia, and Meta) trade at a hefty P/E premium compared to the rest of the market, but relative valuations are more in line with recent averages after accounting for expected growth (forward P/Es). According to data from Goldman Sachs, the Magnificent Seven trades at a P/E of 29x, 1.7x the 16x P/E multiple of the median S&P 500 stock. However, using PEG ratios as a comparison (P/E ratio divided by long-term EPS growth rate), the “Mag 7” is trading on top of the 10-year median level, 0.87x that of the S&P 500.

One of the reasons the “Mag 7” stocks have driven the bulk of the S&P 500 returns this year is that expected sales growth remains well above the remaining 493 names. However, their projected sales growth remains well below that of 2013-2022. Given their size, it will be challenging to grow sales even faster – so the focus will now turn to margin growth (projected to be 225 vs. 10% for the remaining 493 stocks) to justify their high P/E ratios.

Bond Valuations Based On Forward Assumptions
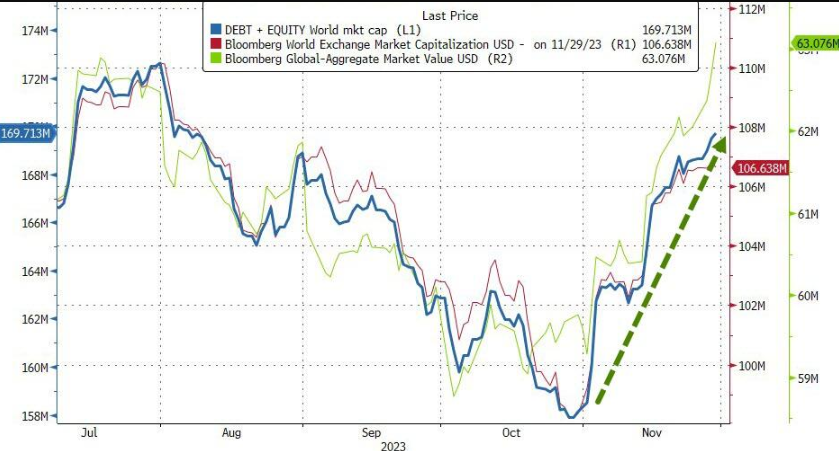
November saw the biggest (calendar) month decline in 10Y UST yields since the Great Financial Crisis (GFC). With equities, global bond and stock markets added over 11 trillion in capitalization last month. This is the second biggest monthly gain in history (November 2020 added 12.5 trillion).
The energy sector ended the month in the red, while tech and real estate were the big winners.

Energy stocks have followed oil prices, which have fallen for the second straight month, with WTI finding resistance at the 200-day moving average (DMA) last week. However, last Thursday, the OPEC+ group agreed to additional output curbs of 1 million barrels daily to send higher prices. The deeper reductions come alongside an extension of Saudi Arabia’s unilateral reduction of one million barrels per day.
The announcement led traders to believe those reductions were voluntary and not official requirements; consequently, oil rose modestly on Friday. We think that OPEC+ (led by the Saudis) would like oil prices at least $10-15 dollars higher, and if prices stay at these levels, we expect additional reductions.

What’s The Value Of Our Investment In the Future (do we trade our prize)?
At the end of October, it became pretty clear that the Fed was done raising rates. We have highlighted various data points showing the economy's rapid slowdown (deflation) as the lag effect of rate hikes took hold.
We still believe that inflation (in various parts of CPI) will prove sticker than most expect, and we continue to believe that the Fed will keep rates “higher for longer” unless we see tangible signs of recession, which creates other challenges (note; we expect a moderate slowdown in late Q2 or early Q3 2024).
But based on interest rate futures, we are clearly in the minority as they now show rate cuts beginning in March 2024. Traders are also increasing the change of rate cuts starting as soon as January 2024 (now at around 10%). This is an abrupt change since only three weeks ago, markets saw a 50% chance of an additional rate hike and rate cuts beginning in June 2024.
This happened while Fed Chairman Powell said that the market's expectations of rate cuts are “premature.” We agree, but with so much cash on the sidelines, the FOMO (fear of missing out) seems alive and well.
We believe that Q1 and maybe Q2 will be bumpy for equities as signs of continued deflation and recession hit the tape. At the same time, inflation remains challenging to reach target, leaving the Fed no choice but to hold rates at current levels—chart source Kobeissi Letter.

Another issue that continues to be talked about on bond desks is the lack of fiscal responsibility by either party in Washington. Spending has been part of the M.O. in DC for decades, but the debt is getting to the delta where interest payments are beyond the scope of recapture and create uncertainty by bondholders for the Government to repay.
This is not hyperbole; consider various sovereign nations reducing their exposure to US Government Debt. Like any market, prices and yields are supply and demand-driven, and with fewer buyers, rates would have to increase to entice buyers.
The US National Debt increased by 2.36 trillion dollars since the debt ceiling was suspended less than six months ago (not even an entire year!). Current interest payments are over one trillion dollars, and the total US debt is approaching 34 trillion.
According to CEIC, at the end of September, government debt to GDP was 123.0% compared with 121.6% in the previous quarter. Other than Japan, it’s the highest of any G20 country.

As Charlie Biello points out, even with the modest rate increases over the last 18 months, the effect on housing has been horrendous. According to Charlie, the US housing affordability is worse today than at the peak of the previous housing bubble (let that sink in). The median American household would need to spend 44.7% of their income to afford the median-priced home, a record high.

As housing is less affordable, personal debt continues to skyrocket, and, according to Experian, delinquencies are hitting record levels. The credit agency said 6.11% of borrowers with a FICO score between 501 and 600 are now delinquent. That is a 30% increase since the beginning of the year.
They also reported that in the subprime space, the percentage of borrowers 60 days past due on their auto loans has reached the highest level since 1996 (even higher than in 2008 & 2009).
We realize this is the subprime space, but in data going back 50 years, the subprime market is the leading indicator of economic stress. So, if history is any lesson, it’s a negative development.

Data like the subprime market may be why the Fed lowers rates ahead of what we anticipate; the point we are making this week is that we believe November’s rally (although not surprising) is ahead of itself. We have talked at nauseam at the S&P 500’s trading range of 4200-4600. The market is sitting at 4594 (as of Friday’s 12/1/2023 close), and if we break the resistance of 4600, we believe 4700-4750 is achievable by year-end. We encourage investors to rebalance positions at those levels as we think the early part of the year may be more of a “zonk” than markets anticipate.
Charlie Munger
We were fortunate to have met and listened to Mr. Munger in our early days on Wall Street. If you haven’t read his “Psychology of Human Misjudgment,” we will leave a link below, and we encourage you to read his thoughts. They are no less than brilliant.
https://buffettmungerwisdom.files.wordpress.com/2013/01/mungerspeech_june_95.pdf
This week's bullets are some of our favorite quotes from Mr. Munger over the many years.
“We were not ideally located to be high-tech wizards. How many people our age quickly mastered Google? I’ve been to Google headquarters. It looked to me like a kindergarten.” Berkshire Hathaway Meeting, 2018
“We have computers with algorithms trading against other computers. We have people who know nothing about stocks, being advised by stockbrokers who know even less.” Berkshire Hathaway Meeting. 2022
“I constantly see people rise in life who are not the smartest, sometimes not even the most diligent, but they are learning machines. They go to bed every night a little wiser than when they got up, and boy, does that help – particularly when you have a long run ahead of you.” USC Law School Commencement Address.
On the government deficit: “A man who jumps out of a building is OK until he hits the ground.” 2023 Berkshire Hathaway Meeting.
There are so many more; his passing is a loss on many levels.
Trade carefully. Thank you for listening.
Have a great week.
Stephen Colavito
Chief Investment Officer
San Blas Securities
stephen.colavito@sanblas-advisory.com
General Disclosures
This research is for San Blas Clients only. The opinions represented in this research are that of the CIO, not advisors or officers of San Blas Securities. This research is based on current public information that we consider reliable, but we need to represent it as accurate and complete, and it should not be relied on as such. The information, opinions, estimates, and forecasts contained herein are as of the date hereof and are subject to change without prior notification. We seek to update our research as appropriate. Some research can and will be published irregularly as appropriate in the analyst’s judgment.
This research is not an offer to sell or solicitation of an offer to buy a security in any jurisdiction where such an offer or solicitation would be illegal. It does not constitute a personal recommendation or consider our clients' particular investment objectives, financial situations, or needs (individual or corporate). Clients should consider whether any advice or guidance in this research suits their specific circumstances and, if appropriate, seek professional advice, including tax advice. Past performance is not a guide for future performance, future returns are not guaranteed, and a loss of original capital may occur. More information on San Blas Securities is available at www.sanblassecurities.com.