The Weekly Random Walk – October 23, 2023 From Stephen Colavito
An Aggregation of Various Economic, Market Research, and Data

Wag The Dog
Wag The Dog is a 1997 political satire film starring Dustin Hoffman and Robert De Niro. The film centers on a spin doctor and a Hollywood producer who fabricate a war in Albania to distract voters from a presidential sex scandal.
What was interesting about the film, when it was released, was a month after the Clinton-Lewinsky scandal and the subsequent bombing of the Al-Shifa pharmaceutical factory in Sudan by the Clinton administration in August 1998, which prompted the media to draw comparisons between the film and reality.
The war and Ukraine and now the Middle East are not “Wag The Dog” events, but they can distract from the global economic struggles facing a lot of economies (including the U.S.).
The Currency War
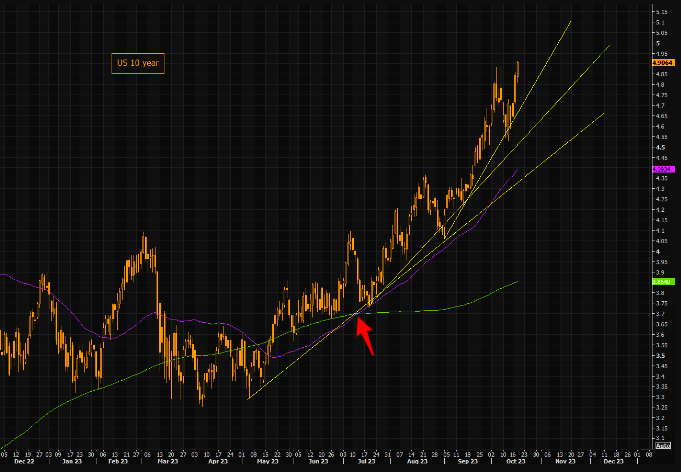
This week, we will concentrate on rates because it has become a barometer for the economy and equities. The 10-year UST is now very close to the five percent level and seems to be on a path to breaking that resistance. In trying to explain why rates have gone higher, some in our field of economics have argued that “Bidenomics” has decoupled the U.S. from the rest of the world, which now finds itself in some golden age of economic growth (where mortgages have hit a 20-year high of 8% and consumer credit cards are maxed out) or that term premium is driving rates higher. We would argue those have little impact currently.
When looking at the latest TIC data, we would argue the number one reason that rates continue to go higher is China, which has sold its massive inventory of Treasury holdings in 20 of the past 22 months.
But wait, there’s more; as Bloomberg reported last week, Chinese investors offloaded stocks and bonds in August, fueling speculation that Beijing is liquidating FX reserves to defend against a weakening yuan for the same reasons Russia liquidated its own Treasury holdings in 2018.
If China has any intention to annex Taiwan (a.k.a. – go to war) in the future, it will want to shift away from U.S. treasury holdings; after all, it saw how quickly Russia was cut off from SWIFT (which is why they have been aggressive in their promotion of BRICS) and broader dollar regime.
If the selling of Treasuries continues by China and other countries, it may quickly normalize the yield curve once the Fed starts cutting rates (our estimation is Q3 or Q4 next year) as the long end stays higher for longer.

China isn’t the only sovereign entity selling Treasuries, putting pressure on the long end of the yield curve. The trend lines for the 10-year UST are getting steeper and steeper.
Foot Soldiers
Who is picking up some of the additional supply in Treasuries? When looking at the data, 73% of the net issuance of Treasuries since the beginning of 2022 has been bought by households. Goldman Sachs reported that households (which include domestic hedge funds) now own 9% of outstanding U.S. Treasuries, up from 2% at the start of 2022; however, U.S. households’ 42% allocation to equities ranks in the 96th percentile since 1952 vs. 17% exposure to bonds ranks in the 46th percentile.
Retail investors are still overweight equities, and we have a long way to go before “households” reach risk parity.

Fed Diplomacy
Several Fed officials over the last few weeks (including Chairman Powell) have changed their rhetoric on the outlook for interest rate policy (Fed Funds). The tightening of financial conditions through higher long-term rates and lower equity prices is equivalent to 60 bps of additional hikes, based on the Fed’s models. The speed at which the curve has sold off and steepened appears to have spooked (I’ll use that term more for our Halloween edition because the puns are perfect) policymakers at the Fed, including the long-standing “hawks.”
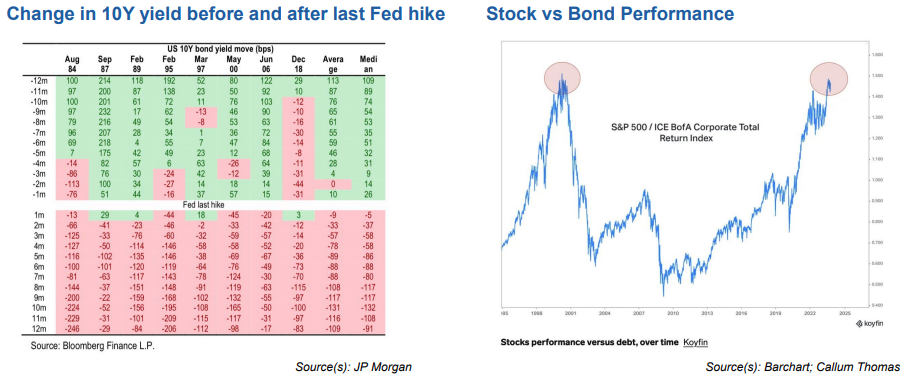
If the Fed is indeed done (we still think there is a 50/50 chance for a hike in December), it would be a positive event for Treasury bonds. Historically, rates have dropped an average of 109 bps twelve months following the end of the tightening cycle (this is why we think rates will be 100 bps lower this time next year). If this plays out, over the next 12-18 months, bonds could outperform stocks on a risk-adjusted basis (notice we didn’t say absolute basis), something that hasn’t happened in over ten years.
Fed Spin
The reason we think the Fed will wait until December (if they raise rates at all) is based on “Fed Speak” over the last few weeks. Powell spoke last week, admitting that the game was slipping away from the Fed. While the Fed continues to “watch the data,” they realize that the recent move in Treasury yields has almost nothing to do with Fed Funds and everything to do with fiscal policy from Washington.
In speaking with trading desks over the last week, the theme we hear again and again is that rates are driving equities right now.

Cease Fire
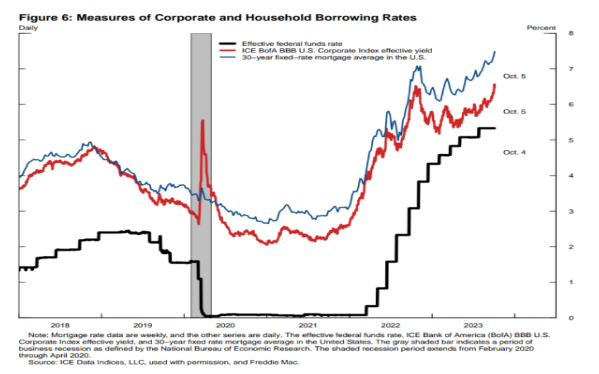
Along those same lines, a few weeks ago, Fed Vice Chair Jefferson detailed his views on the tightening that remained in the pipeline as to why he remains cautious regarding further rate hikes (note: he is considered a “dove” at the FOMC), saying: “Large businesses rely on corporate bonds and bank loans as sources of debt financing. Corporate bonds tend to be fixed-rate debt, while bank loans tend to be floating-rate debt. As most nonfinancial corporate debt is in the form of corporate bonds that were issued before 2022, the interest rate average across all outstanding corporate debt is still low. This rate will likely increase next year when a larger fraction of maturing corporate bonds needs to be refinanced. I will be mindful of the additional tightening in train because of our past rate hikes as I consider whether there is a need to tighten policy further in the future.” (National Association of Business Economics Annual Meeting).
“Hold The Line”
Q3 earnings have come in somewhat mixed over the last few weeks. This week will be interesting as some “magnificent 7” stocks report earnings. There hasn’t been much discussion that the growth trajectory in those stocks implies a lower sensitivity to real rates (more on that in the second chart); however, it’s interesting to see that the equal-weighted S&P P/E ratio also appears to recently show low sensitivity to the jump in higher 10-year rates. One reason may be the Fed’s talk about ending their hiking cycle.

As you can see in the “shark chart” below, the gap between the Nasdaq (driven by the magnificent 7) and the U.S. 10-year is getting wider and wider. So, the question is, do rates (inverted in this chart) move lower to close the gap, or does the Nasdaq fall in price to get closer to rates? History would say one of those things needs to happen.

Bullets
We have a lot of bullet points we want to cover this week.
Money market funds have been winners since SVB collapsed, but that has changed, and they outflows last week as banks saw inflows for the 3rd straight week. Big banks like JP Morgan, Citi, Wells, and Bank of America all reported solid earnings, which may have given investors confidence to return their deposits with the banks. The Fed’s emergency funding facility for banks remained at record highs, around 109 billion, but stability in funding for small and mid-sized banks is needed to maintain a healthy sector.
While banks build up their reserves, mortgage demand is one thing they are not doing (or seeing). Last week, the Mortgage Bankers Association (MBA) Index of mortgage applications fell 6.9% to the lowest level since 1995. The data also showed that the average rate on a popular 30-year loan climbed for the third week and is now hovering at 8%. Mortgage application volume is down 21% compared to last year.
Banks with mortgage and commercial loans (in multi-family) in San Franciso will have problems if loans default. High crime rates are putting pressure on real estate values within the city. A case in point is that one of San Francisco’s largest apartment buildings reported losing half of its value in the last five years. NEMA, the 754-unit apartment building once valued at 543 million in 2018, is now valued at 279 million (per the San Francisco Chronicle). If and when the city gets fed up with crime and homelessness, it is estimated to take over ten years to recover and return to the thriving town it once was. That’s “if” the city takes the necessary steps.
For those buying municipal bonds, due diligence is needed in cities and states experiencing many illegal immigrants invading their towns. Even “wealthy” states like Florida that have balanced budgets are feeling the expense of illegals. Presidential candidate Ron DeSantis noted the millions of dollars in cost for uncompensated hospital care to migrants. New York, a sanctuary city since 1989, is spending almost 10 million daily to care for migrants, including some 3,000 families the city puts up in hotels each night. Several Democratic states, including California, Illinois, and New York, have expanded access for illegal immigrants to social programs like Medicaid, deeming it humane. Now, they are facing eye-watering unanticipated bills as illegals deluge the system. We would urge additional due diligence and higher credit quality when buying municipal bonds, as the long-term ramifications of these social programs have yet to be felt.
· Lastly, we spoke to several equity trading desks last week. Consensus discussions revolved around equity pressure coming from a lot of mutual funds that were tax-loss selling (particularly in the lower-quality pockets of technology). Markets are now nervous and uncertain (two wars, dislocated DC, fiscal negligence, etc.), which is never great for positive sentiment. The S&P 500 is now at the lower end of the trading range 4224 (4200 – 4600). The index is sitting at 100 DMA, and a break of 4200 would likely mean a move to its trend line, which would be at 4085. The good news is that markets are oversold, and the CNN Risk/Greed index is at 26 (lower end of the fear range). Fingers crossed, we hold.
Trade carefully. Thank you for listening.
Have a great week.
Stephen Colavito
Chief Investment Officer
San Blas Securities
stephen.colavito@sanblas-advisory.com
General Disclosures
This research is for San Blas Clients only. The opinions represented in this research are that of the CIO, not advisors or officers of San Blas Securities. This research is based on current public information that we consider reliable, but we need to represent it as accurate and complete, and it should not be relied on as such. The information, opinions, estimates, and forecasts contained herein are as of the date hereof and are subject to change without prior notification. We seek to update our research as appropriate. Some research can and will be published irregularly as appropriate in the analyst’s judgment.
This research is not an offer to sell or solicitation of an offer to buy a security in any jurisdiction where such an offer or solicitation would be illegal. It does not constitute a personal recommendation or consider our clients' particular investment objectives, financial situations, or needs (individual or corporate). Clients should consider whether any advice or guidance in this research suits their specific circumstances and, if appropriate, seek professional advice, including tax advice. Past performance is not a guide for future performance, future returns are not guaranteed, and a loss of original capital may occur. More information on San Blas Securities is available at www.sanblassecurities.com.